//]]> //]]> Indian Stock Market Analysis

Thursday, November 12, 2020

Stock Market Trade Setup for November 13 : Things to know

On November 12, BSE Sensex was down 236.48 points to close at 43,357.19, while the Nifty50 lost 58.40 points to 12,690.80, formed a bearish candle on daily chart and market closed in the red after eight green sessions. Most action was seen in FMCG, Capital Goods, Realty, and Capital Discretionary stocks while profit-taking was visible in banks, public sector, and energy space. The top gainers on the Nifty included Hindustan Uniliver, Grasim, Shree cement, Hindalco, ITC and top losers are SBI, Kotak Bank, Coal India, Indusind Bank and NTPC.

According to pivot charts, Pivot point for market is 12,685.60. The key support levels for the Nifty is placed at 12,630.05, followed by 12,569.30. If the index moves up, the key resistance levels to watch out for are 12,746.35 and 12,801.90.

Day High - 12,741.15         Day Low - 12,624.85            Market Close - 12,690.80

Pivot Point = (12,690.80+12,741.15+12,624.85)/3 = 12,685.60
Support 1 = 2*12,685.60-12,741.15 = 12,630.05
Support 2 = 12,685.60- (12,741.15-12,624.85) = 12,569.30
Resistance 1 = 2*12,685.60-12,624.85 = 12,746.35
Resistance 2 = 12,685.60+ (12,741.15-12,624.85) = 12,801.90


NSE NIFTY CHART

BSE SENSEX CHART

Stocks in News :

  • IRB Infra posts consolidated net loss of Rs 20 crore in Q2.
  • NDMC announces rebate in Property Tax Bills.
  • Prestige Estates Q2 net profit down 40% at Rs 94 crore.
  • VA Tech WABAG reports Q2 standalone net at Rs 8.02 crore.
  • IL&FS Engineering and Construction Q2 net loss widens to Rs 73.16 crore.
  • Ircon International Q2 consolidated profit marginally up at Rs 84 crore.
  • GE Power India posts Rs 37.4 crore net profit for Q2.
  • Natco Pharma Q2 net profit up 73% to Rs 204 crore.
  • MTNL Q2 loss narrows to Rs 582 crore.
  • Ashoka Buildcon Q2 PAT up six-fold to Rs 70 crore.
  • Uflex Q2 net profit jumps two-fold to Rs 222 crore.
  • V-Mart Retail posts Q2 net loss of Rs 19 crore.
  • Religare Enterprises Q2 net loss narrows to Rs 115 crore.
  • PFC net profit jumps 72% to Rs 4,290 crore in Q2.
  • Zydus Cadila completes phase 2 clinical trial in COVID-19 patients with biological therapy PegiHep.

Wednesday, November 11, 2020

Stock Market Trade Setup for November 12 : Things to know

On November 11, BSE Sensex was up 316.02 points to close at 43,593.67, while the Nifty 50 gained 118.10 points to 12,749.20, formed a bullish candle on daily chart and market closed in the green for the 8th consecutive session. Most action was seen in sectors like Pharma, Metals and IT. The top gainers on the Nifty included Hindalco, Tata Steel, Dr Reddy, Axis Bank, Bajaj Finserv and top losers are Indusind Bank, Reliance, Titan, Asian Paint and Britannia.

According to pivot charts, Pivot point for market is 12,696.67. The key support levels for the Nifty is placed at 12,623.58, followed by 12,498.02. If the index moves up, the key resistance levels to watch out for are 12,822.23 and 12,895.32.

Day High - 12,769.75         Day Low - 12,571.10            Market Close - 12,749.15

Pivot Point = (12,749.15+12,769.75+12,571.10)/3 = 12,696.67
Support 1 = 2*12,696.67-12,769.75 = 12,623.58
Support 2 = 12,696.67- (12,769.75-12,571.10) = 12,498.02
Resistance 1 = 2*12,696.67-12,571.10 = 12,822.23
Resistance 2 = 12,696.67+ (12,769.75-12,571.10) = 12,895.32


NSE NIFTY CHART

BSE SENSEX CHART

Stocks in News :

  • Bharat Forge reports Q2 net loss of Rs 1.32 crore.
  • GMR Infrastructure Q2 net loss widens to Rs 750 crore.
  • Cosmo Films Q2 net profit up 84% to Rs 53 crore.
  • Aurobindo Pharma Q2 profit jumps 26% to Rs 805.6 crore and US business grows 12.5%.
  • BGR Energy Systems Q2 net loss at Rs 151.17 crore.
  • Emami Realty Q2 profit jumps more than 14 times to Rs 34 crore.
  • NHPC net profit down 11% to Rs 1,300 crore in Q2.
  • Spicejet Q2 results cuts down net loss to Rs 112.6 crore and appoints new CFO.
  • Coal India Q2 profit falls 16% to Rs 2,948 crore and declares interim dividend of Rs 7.50 per share. Government to get Rs 3,056 crore dividend from Coal India.
  • Indiabulls Housing Finance net profit declines 54% to Rs 323 crore in Q2.
  • Abbott India Q2 net profit up 1% to Rs 181 crore.
  • LIC Housing Finance Q2 profit up 3% at Rs 790 crore.
  • Godrej Industries Q2 net profit falls 45% and revenue declines 9%.

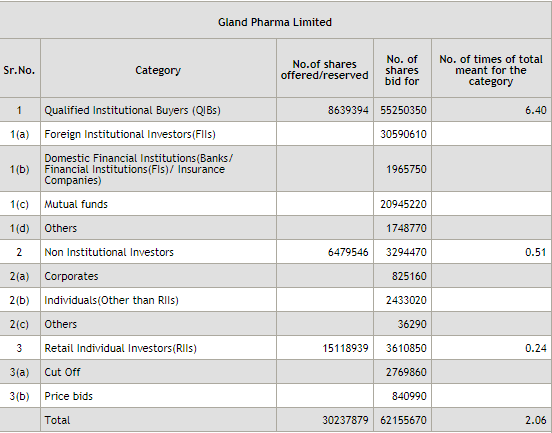
Gland Pharma Ltd IPO subscribed 2.06 times and Retail part subscribed 0.24 times on Last day

The initial public offer (IPO) of Gland Pharma Ltd subscribed 2.06 times on Wednesday the last day of the offering data from stock exchanges show.

Gland Pharma Ltd had set a price band of Rs 1490-1500 per share and the IPO closed on 11th November.

The portion of shares reserved for Qualified institutional investors was subscribed 6.40 times, while shares reserved for retail investors was subscribed 0.24 times.

Tuesday, November 10, 2020

Stock Market Trade Setup for November 11 : Things to know

On November 10, BSE Sensex was up 680.22 points to close at 43,277.65, while the Nifty 50 gained 170.05 points to 12,631.10 and formed a bullish candle on daily chart. Most action was seen in banks, finance, capital goods, realty, as well as oil & gas while mild profit booking was seen in IT, healthcare, and telecom stocks. The top gainers on the Nifty included Bajaj Finance, Indusind Bank, LT, Bajaj Finserv, SBI and top losers are Tech Mahindra, Cipla, HCL Technology, Divis lab and Nestle Industry.

According to pivot charts, Pivot point for market is 12,583.42. The key support levels for the Nifty is placed at 12,522.93, followed by 12,414.77. If the index moves up, the key resistance levels to watch out for are 12,691.58 and 12,752.07.

Day High - 12,643.90         Day Low - 12,475.25            Market Close - 12,631.10

Pivot Point = (12,631.10+12,643.90+12,475.25) = 12,583.42
Support 1 = 2*12,583.42-12,643.90 = 12,522.93
Support 2 = 12,583.42- (12,643.90-12,475.25) = 12,414.77
Resistance 1 = 2*12,583.42-12,475.25 = 12,691.58
Resistance 2 = 12,583.42+ (12,643.90-12,475.25) = 12,752.07


NSE NIFTY CHART


BSE SENSEX CHART

Stocks in News :

  • Exide Industries Q2 net up 4% at Rs 257 crore.
  • Motherson Sumi Q2 net profit up 3% to Rs 388 crore.
  • Tata Power Q2 net up 10% to Rs 371 crore.
  • RITES Q2 consolidated profit down 44% at Rs 132 crore.
  • IDFC net loss narrows to Rs 147 crore in Q2.
  • Dalmia Bharat Sugar reports 11% rise in Q2 profit.
  • GAIL profit dips 9% to Rs 1,068.16 crore in Q2 on gas marketing woes.
  • TTK Prestige Q2 profit falls 19% to Rs 65 crore.
  • Godfrey Phillips India Q2 net profit falls 9.23% to Rs 103.06 crore.
  • M&M Standalone September 2020 Net Sales at Rs 11,710.46 crore, up 5.73%.
  • Tribhovandas Consolidated September 2020 Net Sales at Rs 273.17 crore, down 30.53%.
  • Exide Ind Consolidated September 2020 Net Sales at Rs 4,011.39 crore, up 6.16%.
  • Dalmia Sugar Consolidated September 2020 Net Sales at Rs 719.53 crore, up 78.41%.

Gland Pharma Ltd IPO subscribed 0.22 times and Retail part subscribed 0.15 times on day 2

The initial public offer (IPO) of Gland Pharma Ltd subscribed 0.22 times on Tuesday the second day of the offering data from stock exchanges show.

Gland Pharma Ltd has set a price band of Rs 1490-1500 per share and the IPO closes on 11th November.

The portion of shares reserved for Qualified institutional investors was subscribed 0.48 times, while shares reserved for retail investors was subscribed 0.15 times.

Monday, November 9, 2020

Stock Market Trade Setup for November 10 : Things to know

On November 09, BSE Sensex was up 704.37 points to close at 42,597.43, while the Nifty 50 gained 197.50 points to 12,461.00 and formed a bullish candle on daily chart. Most action was seen in telecom, banks, power, metal, finance, and consumer durable stocks while mild profit-taking was seen in the healthcare space. The top gainers on the Nifty included Divis Lab, Bharti Airtel, Indusind Bank, ICICI Bank, Axis Bank and top losers are Cipla, Adani ports, Maruti, ITC and Grasim.

According to pivot charts, Pivot point for market is 12,434.13. The key support levels for the Nifty is placed at 12,394.22, followed by 12,327.43. If the index moves up, the key resistance levels to watch out for are 12,500.92 and 12,540.83.

Day High - 12,474.05         Day Low - 12,367.35            Market Close - 12,461.00

Pivot Point = (12,461.00+12,474.05+12,367.35) = 12,434.13
Support 1 = 2*12,434.13-12,474.05 = 12,394.22
Support 2 = 12,434.13- (12,474.05-12,367.35) = 12,327.43
Resistance 1 = 2*12,434.13-12,367.35 = 12,500.92
Resistance 2 = 12,434.13+ (12,474.05-12,367.35) = 12,540.83


NSE NIFTY CHART


BSE SENSEX CHART

Stocks in News :

  • OIL India Q2 profit drops 42% to Rs 381.75 crore on blowout expense.
  • Akzo Nobel India Q2 net profit up 34.6% to Rs 66.28 crore.
  • Future Lifestyle Fashion reports Q2 net loss of Rs 258 crore.
  • Future Supply Chain Solutions reports Q2 net loss of Rs 68.75 crore.
  • REC Consolidated September 2020 Net Sales at Rs 8,810.00 crore, up 17.82% YoY.
  • Bharat Elec Consolidated September 2020 Net Sales at Rs 3,195.24 crore, up 16.26% YoY.
  • Ujjivan Small Finance Bank Q2 profit up marginally at Rs 96 crore.
  • FDC Standalone September 2020 Net Sales at Rs 375.54 crore, up 8.8% YoY.
  • Bharat Elec Standalone September 2020 Net Sales at Rs 3,188.66 crore, up 16.26% YoY.
  • Schaeffler Ind Standalone September 2020 Net Sales at Rs 1,120.65 crore, up 8.26% YoY.